How Liquor Store Profit Margins Actually Work (And How to Improve Yours)
By Alden Morris, Founder & Principal Strategist32 min read
Listen to this article41:12
Schedule a free strategy call and Intentionally Creative will build a custom plan for you.
Schedule Your Free Strategy CallFree audit. No commitment.
Get a Free Audit. No commitment.
Discover how liquor store profit margins really work, from gross margin benchmarks to markup strategies and operational costs. Get actionable tips to improve your store's profitability today.
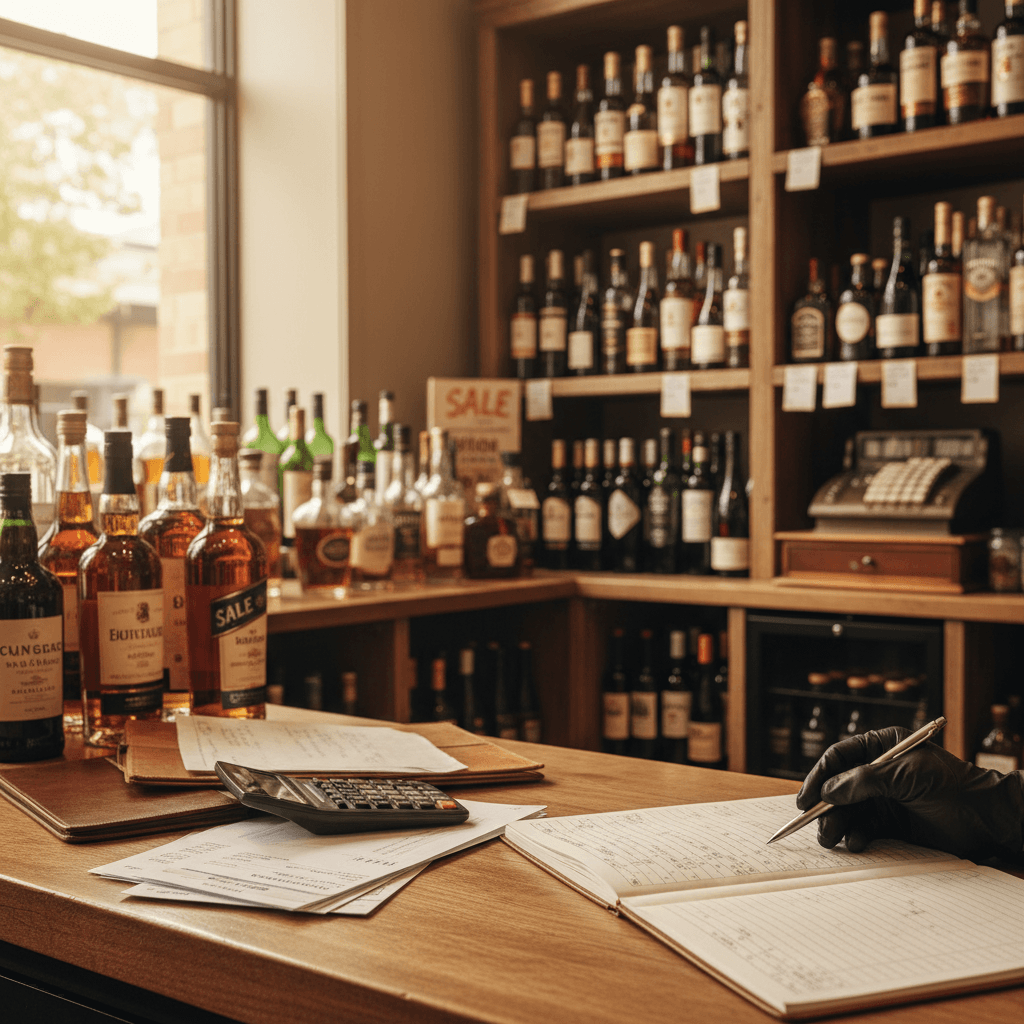
Selling alcohol does not guarantee you'll make money. It guarantees you'll have competition, compliance costs, and razor-thin margins that punish the unprepared.
The assumption that liquor stores print money is one of the most persistent myths in retail. Walk into any thriving bottle shop and the shelves look full, the register looks busy, and the math looks easy. It isn't.
Executive Summary: Liquor store profit margins are narrower than most owners expect. According to research from POSNation ↗, the average net profit margin for a liquor store runs between 2% and 10%, with most independent retailers landing closer to the lower end after factoring in shrinkage, licensing fees, staffing, and distributor pricing. Gross margins typically range from 20% to 30% depending on product category, spirits outperform beer, and private label outperforms both. The stores that consistently hit the top of that range share one thing: they treat operations and marketing as seriously as their product selection. This guide breaks down exactly where margin is made, where it's lost, and what separates a store doing $2M in revenue with 4% net profit from one doing the same volume and keeping 9%.
State regulations dictate what you can stock, how you can advertise, and sometimes what you can charge. Distributors control your access to allocated products. And your customer down the street can order the same bottle from Total Wine with free shipping.
The stores that thrive understand their numbers at the SKU level, not just the category level. That's where this guide starts.
Here's what actually happens when you look at your product mix through a margin lens instead of a volume lens: everything you thought you knew about your best sellers starts to shift.
A store owner I know in the midwest was convinced beer was his bread and butter. It drove the most transactions, filled the coolers, and kept customers coming back. Then he ran the actual numbers. Beer was eating floor space, cooler electricity, and staff time, and delivering the thinnest margins in the building. That's a story playing out in liquor stores across the country.
Spirits: The High-Margin Workhorse
Spirits carry markups ranging from 25% on well liquor up to 45% or more on premium and ultra-premium tiers. The math on craft and small-batch products gets even more interesting, customers expect to pay a premium, and they're less likely to price-shop a boutique rye whiskey on Drizly than they are a handle of Tito's. Bourbon and American whiskey sit in a sweet spot: high consumer demand, strong brand loyalty, and margin structures that reward stores willing to build a real selection. According to POSNation, spirits consistently rank as the highest-margin primary category in liquor retail.
Wine: Volume vs. Margin Trade-offs
Wine margins typically land between 28% and 50%, but the category carries hidden costs that erode that number fast. Slow-moving bottles tie up cash. Improper storage damages inventory. Private label programs and exclusive regional imports are where smart operators push back, owning a label or locking in an exclusive import gives you a product nobody else can discount against you. That's real margin protection.
Beer: Low Margin, High Volume
Domestic macro beer, your Bud Light 30-packs, runs razor-thin margins, sometimes under 20%. Craft beer does better, but not dramatically so. The strategic play here isn't to maximize beer margin. It's to use beer as a traffic driver while making sure your floor layout and staff training convert those beer buyers into spirit or accessory purchases before they leave.
Accessories, Mixers & Non-Alcohol Items
Here's what actually happens when you open your doors every morning: a dozen different cost centers start pulling at your margin before you sell a single bottle.
Shrinkage alone hits harder than most owners expect. Industry data shows retail alcohol shrinkage averages 1–2% of revenue annually, but in high-traffic urban stores, that number climbs fast.
COGS typically runs 65–80% of gross revenue in alcohol retail. That's your margin foundation, and distributor relationships determine how solid it is.
Here's the mechanic: distributors tier their pricing by volume. Hit $10,000/month with a single distributor and your per-case cost drops. Miss that threshold and you're paying the same rack rate as a convenience store. The delta matters.
Control states change the equation entirely. In Pennsylvania or Utah, you buy through the state, no negotiating, no relationship leverage. Open markets like Texas or Florida let you work multiple distributors against each other. Same product, different COGS. That's not a small difference; it's the difference between 28% gross margin and 35%.
Rent should sit at 5–10% of gross revenue. If you're above that, your location is eating your profit.
Labor is trickier. Scheduling inefficiency, overstaffing slow Tuesday afternoons while understaffing Friday evenings, bleeds margin silently. Target labor at 10–15% of revenue. Every hour over that threshold is margin you're handing back.
Utilities, insurance, and licensing fees stack quietly. A single liquor license renewal can run $1,500, $14,000 depending on your state. Budget for it twelve months out, not thirty days out.
Founder and Principal Strategist at Intentionally Creative. 10+ years in three-tier beverage industry marketing, 3 patents pending, CityHive partner. Runs growth for independent liquor retailers and DTC brands.
Here's what actually happens when you look at your liquor store's revenue without separating gross from net margin, you think you're doing fine, then tax season hits and you wonder where the money went.
Understanding both numbers isn't optional. It's the difference between a store that survives and one that scales.
Gross margin is simple: take your revenue, subtract what you paid for the product (COGS), and that's your number. If you sold $500,000 in spirits and paid $375,000 to stock those shelves, your gross margin is 25%.
Net margin is the real story. After rent, payroll, utilities, licensing fees, credit card processing, and every other operating cost bleeds out, what's actually left? That's your net.
Here's how to calculate each:
According to POSNation ↗, liquor retailers typically run gross margins between 20–30%. That sounds healthy until operating costs compress it down to something far thinner.
The average liquor store net profit margin lands between 2–10%, with most independent stores clustering in the 5–8% range depending on size, format, and state. A high-volume urban store moving $2M+ annually operates differently than a 1,200-square-foot neighborhood shop in a control state, and their margins reflect that gap dramatically.
Compared to other retail sectors, liquor stores perform modestly. Grocery retail averages 1–3% net margin, so liquor looks favorable. But specialty retail can hit 15%+, which puts the ceiling in perspective.
The average profit margin for a liquor store sits between 2% and 10% net, with gross margins typically ranging from 20% to 30%. Gross margin measures revenue minus the direct cost of purchasing inventory, your product cost. Net margin accounts for every expense: rent, labor, utilities, licensing, and taxes. According to research from SanteHQ ↗, store format, state regulations, and location shift these numbers significantly. A control state like Pennsylvania limits pricing flexibility, compressing margins. A private-market state like Texas gives operators more room to negotiate with distributors and price competitively. Stores that add high-margin categories, craft spirits, private label, accessories, consistently outperform the average. The 2–10% range isn't fixed. It's a starting point you can move.
Three variables move your number more than anything else:
The benchmark is a floor, not a ceiling. Try this yourself: pull your last 12 months of P&L, calculate both margins separately, then compare your gross to your net. The gap between those two numbers tells you exactly where your operation is leaking.
Intentionally Creative specializes in digital marketing strategies that drive real results. Let us show you what's possible.
Schedule a CallSpirits are the workhorse, but accessories, mixers, and non-alcohol items are the hidden profit engine of a well-run liquor store. Glassware, cocktail kits, premium bitters, and craft mixers routinely carry margins of 40–60% or higher, and customers don't price-compare them the way they do a bottle of Maker's Mark. Research from SanteHQ confirms this category is chronically underutilized in independent retail. A $14 bottle of Fever-Tree tonic sitting next to a gin display doesn't just sell itself. It sells at margin levels your spirits shelf can't touch.
Which alcohol category has the highest profit margin for liquor stores?
Spirits generate the highest profit margins among alcohol categories in most liquor stores, with typical markups ranging from 25% on well-tier products to 45% or more on premium and ultra-premium bottles. Craft spirits, small-batch whiskeys, and exclusive imports push those margins even higher because customers are less likely to comparison shop on price. However, the single highest-margin product category in a liquor store is often non-alcohol accessories, glassware, cocktail kits, premium mixers, and bitters routinely carry margins between 40% and 60%. Spirits win on volume and margin combined, making them the primary profit driver, while accessories represent an underutilized opportunity that most independent stores leave on the table. Beer, by contrast, drives foot traffic but delivers the thinnest margins of any category, often falling below 20% on domestic macro products.
Try this yourself: pull your sales data by category and calculate gross margin dollars, not just percentage, for each one. Volume hides a lot. What you'll likely find is that a focused push on premium spirits and accessories delivers more profit per square foot than any expansion of your beer cooler ever will.
The biggest costs that reduce liquor store profit margins are COGS (typically 65–80% of revenue), rent, labor, shrinkage, and regulatory compliance fees. COGS is the dominant pressure point, your buy-in price from distributors or state control boards sets your margin ceiling before you factor in anything else. Rent benchmarks at 5–10% of revenue; anything above signals a location problem. Labor should stay between 10–15%. Shrinkage, internal theft, shoplifting, and spoilage, adds another 1–2% drag, with craft beer and natural wine carrying the highest spoilage risk due to shorter shelf lives. According to research from POSNation, compliance costs including licensing, training, and legal fees create uneven burdens state by state, sometimes adding thousands annually that open-market operators don't face. Stack all of these together and you understand why net margins land at just 2–10%.
Internal theft causes more shrinkage than shoplifting in most stores, that's uncomfortable but true. Camera placement at the POS terminal, not just the door, is where the data points. For craft beer and wine, FIFO rotation and smaller initial order quantities reduce spoilage exposure. Don't stock 24 units of a $22 natural wine until you've proven velocity on 6.
Compliance isn't a one-time cost. It's a recurring line item that varies wildly by state.
Responsible beverage service training, license renewals, legal review of advertising, these add up to $3,000, $20,000 annually depending on your jurisdiction. Minimum pricing laws in states like Connecticut or Maryland create a margin floor, which sounds protective but actually limits your ability to compete on price during high-velocity periods like the holidays.
Try this yourself: Pull your P&L and calculate each cost center as a percentage of gross revenue. COGS, rent, labor, shrinkage, compliance, line them up. If your combined overhead exceeds 90% of revenue, you're not running a business. You're running a very expensive job.
Here's what actually happens when you price everything the same way: you leave money on the table with specialty bottles and lose customers on the stuff they can buy anywhere.
The myth worth busting first, there's no single "right" markup for a liquor store. The operators who win on margin run a deliberate pricing architecture, not a flat percentage across the board.
Cost-plus pricing works when you hold something nobody else has. A single-barrel bourbon allocated exclusively to your store? Price it for what it's worth to your customer, not what your competitor charges for a standard expression. You set the market. But apply that same logic to a 750ml Tito's, and you'll watch customers walk out and order it from Drizly.
High-velocity, price-sensitive SKUs, your Jameson, your Yellow Tail, your White Claw 12-packs, demand competitive pricing. Customers know exactly what those cost. Match the market or lose the basket entirely.
The race to the bottom happens when stores panic-price commodity products without a strategy. Undercutting by $0.50 on a $14 bottle saves your customer nothing meaningful and costs you real margin dollars at volume.
What to do instead:
Keystone markup, doubling your cost, translates to a 50% markup on cost, which equals roughly a 33% gross margin. According to data from POSNation, most liquor stores operate between 20–30% net margin, which means keystone is your floor, not your ceiling.
Categories where you can exceed keystone without blinking: craft spirits with limited distribution, premium mixers and garnishes, proprietary gift sets you assemble in-house, and local craft beer with no off-premise price anchoring.
Loss leaders have a legitimate role. A sharply priced 30-rack of Bud Light on a holiday weekend pulls traffic. The margin hit is real, but if that customer grabs a bottle of Casamigos and a bag of ice on the same trip, you've won the basket. The math works when you engineer it intentionally.
Build your shelf around good-better-best. Every major category needs an entry point, a mid-tier, and an aspirational option. This isn't just merchandising, it's margin architecture.
Anchoring is the mechanism that makes mid-tier look like value. Place a $180 Japanese whisky next to a $65 single malt, and the $65 bottle suddenly feels accessible. Customers don't evaluate price in isolation, they evaluate it relative to what's next to it.
Private label and exclusive products are your best margin-protection tools. A store-exclusive barrel pick carries your brand, commands a premium, and has zero price comparison online. Research from IBISWORLD confirms that differentiated product assortment is a primary driver of margin sustainability in beer, wine, and spirits retail.
A liquor store should price its products to maximize profit margins by applying a tiered, category-specific strategy rather than a flat markup across all SKUs. Commodity products with high price visibility, like major vodka and whiskey brands, should be priced competitively to protect customer trust and basket size. Specialty, allocated, or exclusive items should be priced on perceived value, often well above keystone. Promotional pricing should be structured around supplier-funded mechanisms like MCDs (merchandising allowances) and scan-downs, which let you pass savings to customers without sacrificing your own margin. Seasonal promotions work best when they're time-bounded and tied to a clear traffic objective. The trap most stores fall into is perpetual discounting, running the same "sale" every week until customers refuse to pay full price. Margin protection comes from discipline: promote with purpose, not out of habit.
Seasonal promotions drive volume when they're structured correctly. A Thanksgiving week promotion on premium wines makes sense, traffic is up, basket size is up, and customers are already in a buying mindset. But that same discount running in February signals to customers that the regular price was fiction.
Supplier-funded promotions, MCDs, scan-downs, OI programs, exist to help you move volume without bleeding your own margin. Use them. Work your distributor reps to understand what's available each quarter and build your promotional calendar around funded activity first.
The perpetual discount trap is real and it's slow-moving damage. Once customers anchor to a sale price, the regular price feels like a penalty. Run promotions with clear start and end dates, communicate the reason (holiday, new arrival, one-time allocation), and hold the line when it's over.
Try this yourself: Pull the last 90 days of your promotional history. Count how many SKUs ran at a discount more than once. If the same products are "on sale" repeatedly, you don't have a promotional strategy, you have a new regular price with extra steps. Reset those items, communicate the value through staff recommendations and shelf talkers, and rebuild the margin you've been giving away.
Here's what actually happens when you ignore inventory turnover: your cash quietly bleeds out through shelf space. A bottle of mid-shelf bourbon sitting for six months isn't neutral, it's a loan you gave your distributor that they never have to pay back.
Calculate your turnover rate with this formula: Cost of Goods Sold ÷ Average Inventory Value. A healthy liquor store hits 8–12x annually on spirits, faster on beer (12–18x), and slower on specialty wine (4–6x). Miss those benchmarks and you're not just sitting on product, you're sitting on margin.
Dead stock is the quiet killer. That case of obscure amaro you bought because a rep was persuasive? It's tying up capital that could fund three cases of Tito's, a SKU that actually moves.
How inventory management affects liquor store profit margins: Inventory management directly determines how much of your gross margin converts into actual profit. Every dollar tied up in slow-moving stock is a dollar unavailable for high-velocity, high-margin products. According to research from POSNation, liquor stores operate on net profit margins of 2–10%, meaning even small inefficiencies in stock management compress already thin returns. Overstocking depresses cash flow, forces markdowns, and increases shrinkage risk. Understocking on top sellers costs you sales and customer loyalty. The stores consistently hitting the upper range of that margin window share one trait, disciplined inventory turnover tracked weekly, not quarterly. Inventory isn't a back-office function. It's a margin strategy.
The 80/20 rule hits hard in liquor retail. Roughly 80% of your revenue comes from 20% of your SKUs. Pull a sales velocity report sorted by gross margin dollars, not just units, and the picture gets uncomfortable fast. That craft gin you love? Twelve bottles sold in four months. The Casamigos you almost didn't reorder? Gone in two weeks.
Cut the underperformers ruthlessly, but do it with data. A SKU moving 1 unit per month with a 45% margin might still earn its shelf space. One moving 1 unit per month at 18% margin? That's a favor to a distributor rep, not a business decision.
Balancing customer requests with margin-conscious buying requires a simple filter: Is this a one-time ask or a recurring demand? Special orders are fine. Stocking three cases of something because one loyal customer asked twice is not.
Bottle POS and Lightspeed both offer liquor-specific inventory tracking that goes beyond basic POS functionality, think automated reorder points, par level alerts, and category-level margin reporting. These aren't nice-to-haves anymore. They're table stakes for any store doing $1M+ in annual revenue.
Set par levels by SKU based on lead time plus average daily sales. If your distributor delivers Tuesday and Thursday, your par level needs to cover the gap plus a 15–20% buffer for demand spikes. That's the math. Seasonal forecasting gets smarter when you pull two years of sales data and map it against your local event calendar, football season, summer holidays, New Year's Eve. The patterns are there. The software just helps you see them faster.
Try this yourself: Pull your bottom 25 SKUs by gross margin dollars this week. If any have been on the shelf longer than 90 days, run a flash sale or return them. Reinvest that cash into your top 5 velocity items. That single move can shift your working capital efficiency more than any pricing adjustment.
Here's what actually happens when a liquor store owner stops relying on foot traffic and starts owning their digital presence: a store doing $800K in annual revenue adds $60K, $90K without changing a single product on the shelf.
That's not a hypothetical. That's what happens when you fix your Google Business Profile, build a loyalty SMS list, and start pushing high-margin products through direct channels instead of hoping customers find them.
Answer Unit, How Digital Marketing Improves Liquor Store Profit Margins
Digital marketing improves liquor store profit margins by driving higher-intent customers to your store, reducing acquisition costs, and creating direct channels to promote your most profitable SKUs. A fully optimized Google Business Profile puts your store in front of shoppers actively searching "liquor store near me", searches that convert at rates far above average retail. Email and SMS campaigns to loyalty customers cost fractions of paid advertising while generating repeat purchases of premium spirits and accessories, which carry 35–45% margins versus 20–25% on commodity beer. Social content builds purchase intent before customers ever walk in. Taken together, these channels shift your customer mix toward higher-spend, higher-frequency buyers, the exact profile that moves your net margin from 5% toward 10% or beyond, according to data from POSNation's liquor store profitability analysis.
Before: Your store ranks on page two for "liquor store near me." A competitor three blocks away, with worse selection, gets the customer because Google trusts their profile more.
After: Your optimized Google Business Profile shows hours, in-stock specials, photos, and 80+ reviews. You're the top local result. That customer walks in already primed to buy.
"Near me" searches for liquor retail carry purchase intent that paid social ads rarely match. The person searching isn't browsing, they need something tonight. According to research compiled by WifaTalents, over 60% of liquor store customers make purchase decisions within a few hours of discovery. Local SEO captures that window.
What actually moves the needle on your Google Business Profile:
Ranking locally doesn't just replace lost foot traffic. It adds a second acquisition channel that compounds over time, unlike paid ads that stop the moment you stop paying.
Your repeat customer is your highest-margin customer. Full stop.
They already trust you. They don't need a coupon to walk in. They respond when you tell them the Pappy allocation just landed or that you're running a private barrel pick this weekend. Research from POSNation confirms that repeat customers in specialty retail spend 67% more per visit than first-time buyers.
Building a loyalty list takes one tool and one ask at the register: "Can I grab your number for exclusive deals and new arrivals?" Most customers say yes.
How to monetize that list without burning it:
The highest-margin products in your store, premium spirits, cocktail accessories, gift sets, rarely sell themselves off the shelf. Direct channels let you tell the story behind a $90 bottle in a way an end-cap never can.
Educational content converts. A 60-second Instagram Reel showing three cocktails you can make with a bottle of Aperol Spritz kit you carry drives people into the store with a specific product in mind. That's not a brand awareness play, that's a margin play.
The platforms that actually work for liquor retail:
One compliance note worth taking seriously: Meta and TikTok both prohibit targeting users under 21 for alcohol content. Your ad account can get flagged or suspended for violations. Age-gating your ad sets isn't optional, it's table stakes.
"The stores winning on social aren't running ads. They're building trust through content, then converting that trust at the register."
— Alden Morris, Founder, Intentionally Creative
Here's the honest math: a general marketing agency will spend your first three months learning what you already know about compliance restrictions, platform rules for alcohol advertising, and the three-tier system dynamics that affect how you can promote supplier brands.
Liquor retail marketing has specific constraints. You can't run standard Facebook lead ads for alcohol without proper compliance disclosures. Certain promotional language around pricing triggers state-level regulatory issues. Google Shopping doesn't support alcohol in most configurations. These aren't edge cases, they're the baseline.
What a specialized partner like Intentionally Creative actually provides:
The framing shift that matters: marketing spend isn't a line item to minimize. It's a lever on your margin. According to IBISWorld's industry data, beer, wine, and liquor stores operate in a sector where revenue per location varies by 3–4x between average and top-performing stores. The difference isn't inventory. It's customer acquisition and retention, which is a marketing problem.
Try this yourself: Pull your last 90 days of sales data and identify your top 10 SKUs by margin percentage (not volume). Now ask: how much of your current marketing promotes those specific products? If the answer is "almost none," you've found your opportunity.
Here's what actually happens when you optimize your liquor store's operations without touching your product mix or pricing: your net margin climbs 3–5 percentage points, often within a single quarter. The mechanics aren't complicated. The discipline is.
Post-pandemic wage pressure hit retail hard, and liquor stores weren't exempt. Labor costs that once hovered around 10% of revenue crept toward 18–20% for stores without scheduling discipline. That gap is pure margin erosion.
The target benchmark: labor as 10–15% of gross revenue. Stores hitting that number aren't cutting staff, they're scheduling smarter. Tools like Homebase or 7shifts let you match shift coverage to your actual traffic patterns (Friday 4–7 PM looks nothing like Tuesday morning). Cross-train every employee to cover at least two roles. One cross-trained staffer eliminates the need for a dedicated overtime call-in, which can run $200, $400 per incident when you factor in premium pay.
Here's something most independent operators don't use: co-op marketing funds. Distributors allocate these dollars every quarter, and a significant portion goes unclaimed because retailers don't ask. Ask. Specifically request promotional allowances tied to display placement, feature pricing, or social media posts featuring the brand.
For volume pricing, look at joining a buying cooperative or retail group. According to research from IBISWorld, independent liquor retailers consistently face margin compression compared to chain operators, largely because chains command volume discounts that independents can't access alone. A buying group closes that gap. Leverage your purchase history data when negotiating terms. Distributors respond to specifics: "I moved 48 cases of your reserve bourbon last quarter" lands harder than a general ask.
Operational changes that increase a liquor store's net profit margin include optimizing labor scheduling to keep payroll at 10–15% of revenue, renegotiating supplier terms using purchase history data, and restructuring store layout to drive higher average transaction values. Cross-training staff reduces overtime dependency, directly cutting one of retail's largest variable costs. Joining a buying cooperative gives independent stores access to volume pricing typically reserved for chains. On the floor, placing high-margin items, private label spirits, premium mixers, accessories, at eye level and near the checkout converts browsers into buyers. Cross-merchandising tequila with premium mixers and branded glassware can increase basket size by 15–20% without requiring a single additional customer. According to POSNation, the average liquor store transaction runs $25, $30; moving that number to $35 through smart merchandising is a margin multiplier that costs nothing to implement.
Store flow matters more than most owners realize. A customer who enters, walks to the back cooler, and exits without passing your high-margin spirits display is a missed opportunity. Position your well and value spirits toward the back. Put your premium and private-label bottles at eye level along the path every customer walks. Place impulse items, cocktail kits, corkscrews, branded mixers, within arm's reach of the register.
Try this yourself: map your store's foot traffic for one week using a simple tally at key zones. Then cross-reference those zones with your margin-by-category data. The mismatch between where customers walk and where your high-margin products live will tell you exactly where to start rearranging.
You can't fix what you don't measure. And most liquor store owners are flying blind.
Here's what actually happens when you ignore KPIs: your gross margin slowly erodes by half a percentage point per quarter, and you don't notice until your accountant delivers bad news at year-end. That's not a cash flow problem. That's a measurement problem.
Five numbers run your store: gross margin %, net margin %, inventory turnover, average transaction value, and customer return rate. Pull them monthly from your POS, Lightspeed, Revel, or IT Retail all surface these natively. According to POSNation, liquor stores average 21–25% gross margins. If yours sits below 20%, something specific is off. Spirits pricing, shrinkage, or vendor terms. Set a 1% improvement target per quarter. That's achievable, and it compounds fast.
Your P&L tells the whole story, if you know how to read it as a margin document, not just a tax document. Scan your cost-of-goods line first. Then labor. Then occupancy. Research from IBISWorld shows labor and rent together consume roughly 15–18% of revenue for typical liquor retailers. If either exceeds benchmark, you've found your leak.
A liquor store owner can benchmark their profit margins against industry standards by tracking five core KPIs monthly and comparing them to published retail averages. According to POSNation and IBISWorld, industry gross margins run 21–25%, net margins land between 2–5%, and inventory turnover should hit 12–18 times annually. Pull these figures directly from your POS and accounting software, QuickBooks or Xero paired with Lightspeed makes this straightforward. Compare your gross margin % line-by-line against these benchmarks. Identify which cost categories, COGS, labor, occupancy, are running above industry norms. If your numbers deviate by more than 2–3 percentage points in any category, that's your starting point for investigation. A retail accountant with beverage alcohol experience can help you interpret the data accurately and set realistic quarterly improvement targets.
When your P&L shows cost lines running hot, bring in a retail accountant who understands the three-tier system. A general CPA won't know that your distributor's pricing structure or your state's markup laws are compressing margins in ways that require specific solutions.
Try this yourself: Pull your last three months of P&L statements and calculate gross margin % for each. If the trend is downward, even slightly, audit your top 20 SKUs by margin contribution. The problem almost always lives there.
What does your store actually mean to the neighborhood?
Think about it. The independent liquor store isn't just a retail transaction, it's where someone grabs a bottle of Barolo for their parents' anniversary dinner, discovers a local craft gin they've never tried, or gets an honest recommendation from someone who actually knows the product. That matters. According to research from IBISWorld, independent retailers still hold meaningful ground in a market increasingly pressured by chains and consolidation.
Here's why that's worth protecting through smarter margins:
The long game belongs to stores that optimize intentionally. Every pricing adjustment, every private label placement, every shrinkage reduction adds up. Liquor store profit margins aren't discovered, they're built, decision by decision.
Where do you actually start?
This guide covered a lot of ground. So here are the highest-leverage moves to prioritize first:
The stores winning right now aren't doing anything exotic. They're executing the basics better than everyone else, and they have marketing that actually brings people through the door.
That's where Intentionally Creative comes in. We're the only digital marketing agency in the US built exclusively for retail liquor stores, with expertise across all three tiers of the beverage alcohol system. We know your business because we've lived it.
Ready to see where your margins are leaking? Contact Intentionally Creative at intentionallycreative.com ↗ to start the conversation.
Your margins won't optimize themselves. But with the right strategy, they'll surprise you.
With a 7x ROAS engine and category-level product ranking strategy, Uncorkit expanded its local and national visibility, translating digital dominance into measurable in-store revenue growth.